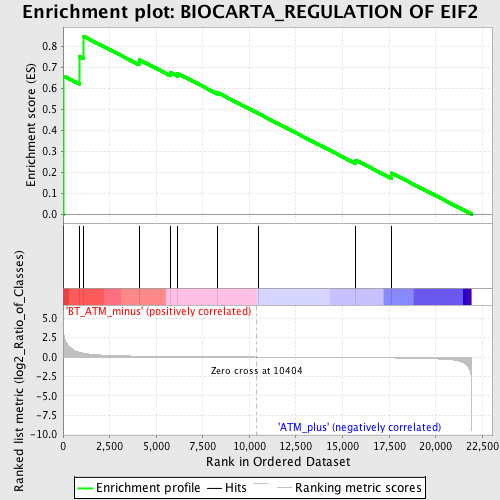
Profile of the Running ES Score & Positions of GeneSet Members on the Rank Ordered List
| Dataset | Set_02_BT_ATM_minus_versus_ATM_plus.phenotype_BT_ATM_minus_versus_ATM_plus.cls #BT_ATM_minus_versus_ATM_plus.phenotype_BT_ATM_minus_versus_ATM_plus.cls #BT_ATM_minus_versus_ATM_plus_repos |
| Phenotype | phenotype_BT_ATM_minus_versus_ATM_plus.cls#BT_ATM_minus_versus_ATM_plus_repos |
| Upregulated in class | BT_ATM_minus |
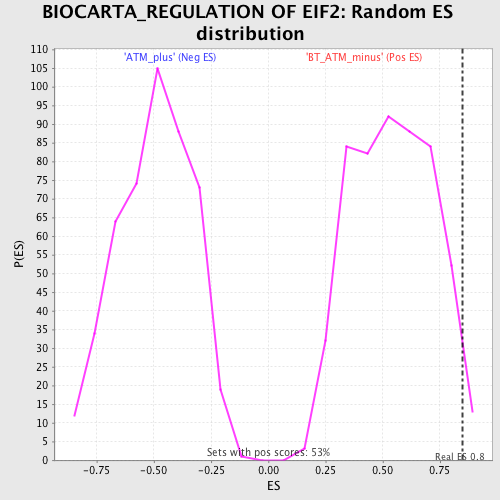
| GeneSet | BIOCARTA_REGULATION OF EIF2 |
| Enrichment Score (ES) | 0.84847957 |
| Normalized Enrichment Score (NES) | 1.5651277 |
| Nominal p-value | 0.024528302 |
| FDR q-value | 0.6889061 |
| FWER p-Value | 1.0 |
| PROBE | DESCRIPTION (from dataset) | GENE SYMBOL | GENE_TITLE | RANK IN GENE LIST | RANK METRIC SCORE | RUNNING ES | CORE ENRICHMENT | |
|---|---|---|---|---|---|---|---|---|
| 1 | EIF2B5 | 1433886_at 1445908_at | 34 | 3.068 | 0.6579 | Yes | ||
| 2 | EIF2AK3 | 1430371_x_at 1449278_at 1453505_a_at | 864 | 0.614 | 0.7521 | Yes | ||
| 3 | EIF2S1 | 1440272_at 1452662_a_at | 1087 | 0.495 | 0.8485 | Yes | ||
| 4 | EIF2S2 | 1417712_at 1417713_at 1441023_at 1448819_at 1448820_a_at 1456617_a_at | 4079 | 0.113 | 0.7363 | No | ||
| 5 | EIF2AK4 | 1421389_a_at 1443235_at | 5749 | 0.071 | 0.6754 | No | ||
| 6 | EIF2AK2 | 1422005_at 1422006_at 1440866_at | 6157 | 0.063 | 0.6704 | No | ||
| 7 | EIF2AK1 | 1421900_at 1421901_at 1430696_at 1436006_at 1453902_at | 8309 | 0.028 | 0.5783 | No | ||
| 8 | GSK3B | 1434439_at 1437001_at 1439931_at 1439949_at 1451020_at 1454958_at | 10465 | -0.001 | 0.4802 | No | ||
| 9 | PPYR1 | 1422271_at | 15712 | -0.077 | 0.2575 | No | ||
| 10 | EIF5 | 1415723_at 1433631_at 1454663_at 1454664_a_at 1456256_at | 17633 | -0.122 | 0.1962 | No |